Get a Newsletter
Email marketing made simple
How to
Optimize email marketing campaigns
Find out how to optimize your email marketing campaigns for better and more profitable results.
Whether you are just starting out or have been working with email marketing for a long time, you should take the follow-up of your campaigns seriously. It shows you how your email campaigns are performing, how they are perceived by recipients, and what you need to improve.
Before you invest time in monitoring and optimizing your email marketing, you should first establish a regularity for your emails. Once you’ve found the routine, you can think about how you can improve your email marketing and get better results from your email campaigns.
So, how should I optimize my email marketing? Let’s have a look at how you can measure the impact of your email campaigns, what metrics you can use, and how you can improve them with practical tips.
What is email marketing optimization?
If your emails don’t reach the right people, at the right time, they won’t be as effective as they could be. This is where optimization comes into play.
Optimizing email marketing means making some kind of improvement to help you achieve your specific goals with your email campaigns and thus also achieve better results. Since email marketing provides an average ROI of $36 for every $1 invested (3,600%) and does not require any major costs, it is a marketing channel that all companies, large and small, should use and continuously work with.
With the help of optimization, you as a business can learn from your previous email campaigns and make changes to improve your performance and more easily reach your specific goals, whether the purpose is to increase sales, strengthen brand awareness, and build customer loyalty.
Metrics for email marketing
To be able to compare your email campaigns and see the impact of your changes, you need to have metrics. Below are a few common email marketing metrics, and which one(s) you should use depends entirely on your specific situation.
If you are making changes to your email subject lines because you want more people to open your emails, it is probably the open rate you want to measure. If you make changes to your call-to-actions because you want to get more people to click through to your website, it’s the click-through rate you want to measure.
If you are not getting conversions but still getting traffic to your website from your email campaigns, it may be a sign that you need to improve the content of the page you send your subscribers to and then measure the conversion rate from email.
As you can see, it all depends on what you are trying to achieve with your improvements. It’s first about identifying what you want to improve and then using a metric that aligns with what you’re trying to optimize.
Open rate
The open rate is a measure of how many people open your emails and is one of the most common ways to measure the impact and interest of your emails.
A good open rate is between 17-28% but differs between industries and other factors, such as whether it’s B2B or B2C. It’s best to research your particular industry so you have something to aim for.
The open rate is calculated by dividing the number of unique recipients who opened your email by the number of email addresses you sent to (minus the email addresses that bounced). Then multiply your result by 100 to get a percentage.
Click-through rate
Click-through rate is a measure of how many people have clicked on links in your emails and is a good metric to measure interest and engagement over time. You can break it down further and measure how many people have clicked on individual links, such as your primary call-to-action.
The average click-through rate for newsletters is 3.7%. If you get there, you should be satisfied and pat yourself on the back. But of course, you want to strive to get as high engagement on your buttons and links as possible.
Click-through rates are calculated by dividing the number of unique link clicks in the emails opened by recipients by the number of emails opened. Then multiply your result by 100 to get a percentage.
Conversion rate
The conversion rate is a measure of how many of your recipients went on to do what you wanted them to do after reading your email – for example, a purchase, a download, or an event registration.
Different sources give different figures when it comes to the average email conversion rate which can be anything from 2% up to 15%. Like the metrics above, it is influenced not only by your industry but also by your target audience and the type of email campaign you have.
To avoid setting unrealistic expectations for your email campaigns, you should know the average conversion rate for your industry. Remember that these figures are just a guideline and that you can achieve even better results than what your industry standard says.
The email conversion rate is calculated by dividing the total number of conversions by the number of emails delivered. Then multiply your result by 100 to get a percentage.
Unsubscribe rate
The unsubscribe rate is a measure of how many of your subscribers have unsubscribed from your emails. It’s a good measure of how the emails you send resonate with recipients and how well they match their tastes and preferences.
The average unsubscribe rate per email is 0.1%. So you can assume that every time you send an email, at least 0.1 will unsubscribe, and you shouldn’t blindly try to get that number down to 0%.
The unsubscribe rate is calculated by dividing the number of unsubscribed users by the number of delivered emails. Then multiply your result by 100 to get a percentage.
Bounce Rate
The bounce rate is a measure of the percentage of your emails that cannot be received by the receiving mail server. You can easily see which email addresses are no longer working to send to.
Note that a distinction is made between hard and soft bounces. A hard bounce is when the email address does not exist. For example, it may be misspelled or deleted by the recipient. A soft bounce is caused by temporary problems such as technical issues on the receiving server, full inboxes, or spam filters.
Aim to keep the bounce rate below 5%. A bounce rate of over 15% is considered very high and is a sign that you should review your mailing lists.
The bounce rate is calculated by dividing the number of bounced emails by the number of delivered emails. Then multiply your result by 100 to get a percentage.
Tips on how to optimize your email marketing
Write email subject lines that get opened
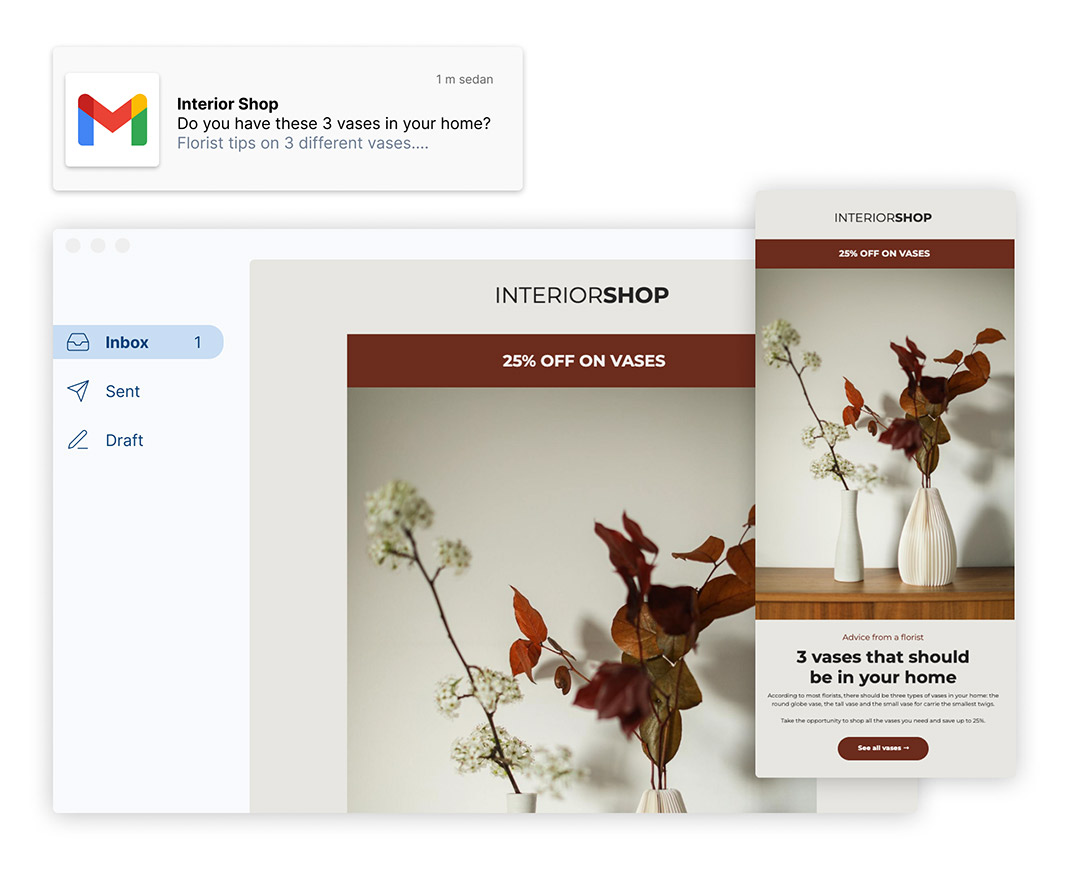
An email subject line is the first thing subscribers see in their inbox and can be the deciding factor in whether or not they open your email. It should not only capture the reader’s interest and be inviting, but also convey a promise of what the reader will get when they read your email.
If you want to optimize your email subject lines to get better open rates, you need to check whether they are relevant to your target audience. For example, if your target audience is distance runners and you sell running shoes, you don’t want to send an email with a subject line about winter boots as they are unlikely to be interested in that.
When it comes to email subject lines, the most important thing is that they are relevant to your potential customers’ needs. If you succeed, more of your emails will be opened and more subscribers will be interested in reading about your offers.
Write engaging copy for your target audience
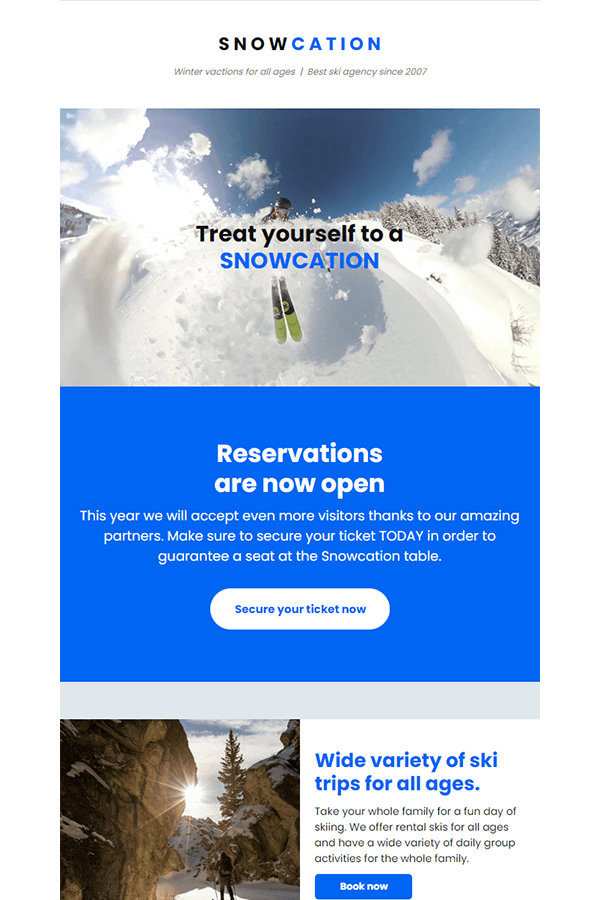
Once you’ve got your recipients to open your email, your next task is to get them to click through to where you want them to go, such as your website. This is done with the help of your content.
Your content should be concise, clear, and relevant to your target audience. It also needs to be compelling and encourage subscribers to do what you want them to do.
You need to convey what you offer and why your audience should be interested. When talking about your offers, you should focus on the benefits they provide rather than their features.
If you talk about features, the focus is on you, your company, and your product. If you talk about benefits, the focus is on how your product or service can help your subscribers with a problem and simplify their lives.
Writing engaging copy for your target audience will help you improve your click-through and conversion rates.
Personalize your content
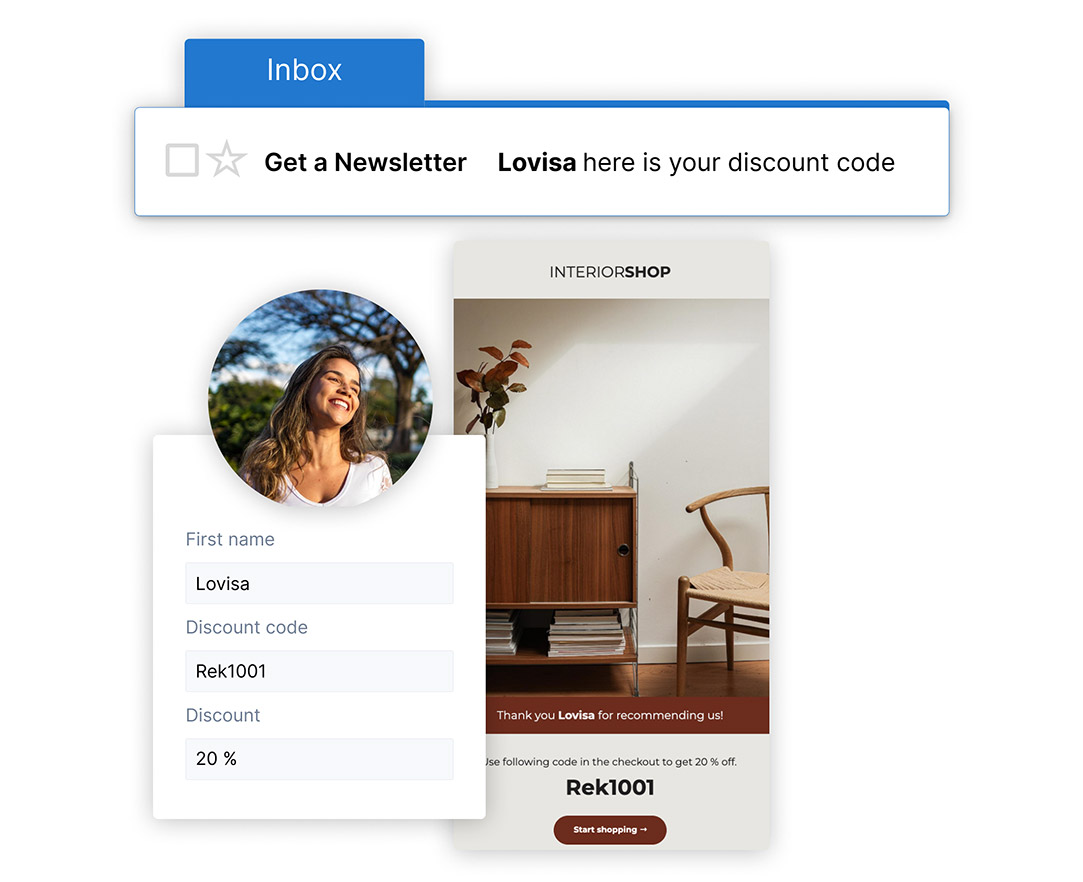
Email marketing allows you to personalize the content for your target audience and increase the relevance of the content to them. For example, addressing your subscribers by their first name in the email subject line will probably lead to a higher open rate than if you had not done so.
You can also personalize the content of your emails to each subscriber. This means you don’t have to create different campaigns for different people on your email list.
Personalization allows you to tailor content to the specific needs, preferences, and behaviors of your subscribers. Sending personalized emails shows that you understand and value them.
If you want to optimize your email campaigns with personalization, you need to review what information you collect from your customers. Once you know that, you can start personalizing your emails and test different variants to find how your audience reacts to them.
Mobile customization
Your emails should be responsive for all types of mobile devices and computers. Make sure all your content is accessible and looks good, no matter what device it is viewed on. The last thing you want to miss out on is opportunities to convert customers and leads just because your email didn’t look good on certain devices.
Add shareable links
An easy way to increase the reach of your content is to let your subscribers help and do it for you. You can add shareable links to your emails that subscribers can share with their friends, family, and colleagues via email or social media.
You should include shareable links in every email and give your subscribers different sharing options. For example, Get a Newsletter allows you to add shareable links for Facebook, LinkedIn, X (Twitter), and email to your email newsletters.
Use clear calls-to-actions (CTAs)
The main goal of your email marketing is to direct subscribers to another page, such as your website, and move them from a click to conversion. You do this by using your call-to-action.
To optimize your call-to-action, you first need to think about what the goal of your email campaign is. Then create a CTA button or link that stands out clearly in your email. Experiment with color, size, and placement to make your call-to-action more attention-grabbing, and make sure it appears at the top of the email so subscribers don’t have to scroll down to find it.
It should also include action-oriented text to prompt subscribers on what to do next. You can test different texts, colors, sizes, and placements for your call-to-actions to see what recipients respond to best and thus improve your click-through rate.
Give the possibility to unsubscribe
First of all, the GDPR requires that it should be easy to unsubscribe from emails.
Laws and regulations aside, you want your subscribers to engage with what you send them. If they’re not interested in receiving your emails, don’t force them to stay on your mailing list. Moreover, not giving subscribers the option to unsubscribe will negatively affect your open and click-through rates.
Make sure to give your subscribers an easy-to-access unsubscribe link. It will help you get a higher-quality email list and give you more accurate metrics around your open and click-through rates.
Review the sender's name and address
When you send an email, it will always tell who the sender is, in other words, your sender name and address. Who is listed as the sender can greatly influence whether your emails are opened or not.
You need to build trust with your subscribers, and if they are not familiar with your sender name, you risk scaring them away.
Therefore, make sure to use a sender name representing your company and preferably a real name as the sender. It builds trust with your target audience, your subscribers may perceive your mailings as more personal, and, above all, it requires little effort on your part.
Whether you’re sending emails from a business or as an individual, make sure to use your sender name and address consistently. It builds recognition for future emails and helps you build trust with recipients.
Optimize sending time
Optimizing the sending time means you can adjust the time of day the mailing gets sent out to best suit your customers or subscribers. It increases the chances of your audience opening and reading your emails.
There is no general time or day that is better than the other, but it is specific to your target audience and requires testing different sending times to find out what suits your audience best.
There are a couple of general guidelines that can be helpful to keep in mind:
- If your email is going out to people in businesses, it might be good to send it during their workday and not too late at night.
- If you sending to people in companies, Mondays are not the most optimal day. Mondays are about getting through all the emails that have come in over the weekend, which creates more distractions from your email being the focus.
- If you are sending it to individuals, it may be better to send it in the morning or late afternoon/evening so they can read the email immediately when they see it in their inbox. If you send emails to individuals in the middle of the day, there is a risk that they will check their inbox but forget due to work or other activities.
- Think about the situation your subscribers are in when they receive your email. For example, if you are sending to individuals, it might be a good idea not to send a sales email the week before they receive their salary.
A/B test your emails
To get better results from your email campaigns, you can test different variants and compare them against each other to see what your subscribers respond to best. For example, you can A/B test various types of content, email subject lines, call-to-actions, and design and see which performs the best.
To conduct an A/B test, you need to be clear about what your goal is with your email. Do you want your open rate to increase, more clicks to your website, more bookings, or even more sales?
Once you know your goal, it will be easier to know which metric(s) to use to compare the results of your A/B test and see which variant performs better.
Continuously testing and measuring the performance of your email campaigns will provide you with a lot of educational information that can help you make better decisions and get better results from each campaign.
Getting started with email automation
Now you have gained insight into how to improve your email campaigns and what metrics you can use to compare results. Basically, it’s all about how you write your emails, that the content is relevant, and that the emails are designed in an appealing way.
If you get that in place, you can test the number of sends, sending times, and so on to further optimize your email campaigns.
This was the last part of this guide, so now it’s time for you to get to work and succeed with your email marketing. If you are still unsure about any area, you can go back and read or get started now with Get a Newsletter’s free plan and your email marketing.
Get started with email marketing
Start creating & sending email newsletters for free with Get a Newsletter to easily reach your subscribers and customers.
Explore Get a Newsletter
Pricing
Find the perfect price plan for you and your business. Get started for free – upgrade as your business grows.
Email marketing
Create personalized customer experiences and engage your target audiences to increase sales and maintain customer loyalty.
Get started for free
Explore newsletters, landing pages, and surveys. Market your
products and services. Increase your sales and customer loyalty.